Monitoring Reports
The reporting module turns the monitoring data mfusion collects into scheduled, shareable documents. Define a report once — which hosts, graphs, and items to include — and mfusion generates it automatically on a daily, weekly, monthly, or yearly schedule and delivers it by email or FTP as a PDF or CSV file.
Typical uses include:
- Customer reporting — service providers send white-labeled monthly reports (with their own logo) to each tenant
- SLA and management reporting — scheduled uptime, availability, and utilization summaries for stakeholders
- Capacity planning — recurring interface-utilization and traffic-trend reports for engineering review
- Data export — CSV output for further processing in external tools
Navigate to REPORTS in the left menu.
Reports List
The Reports page lists all defined reports with their delivery status:
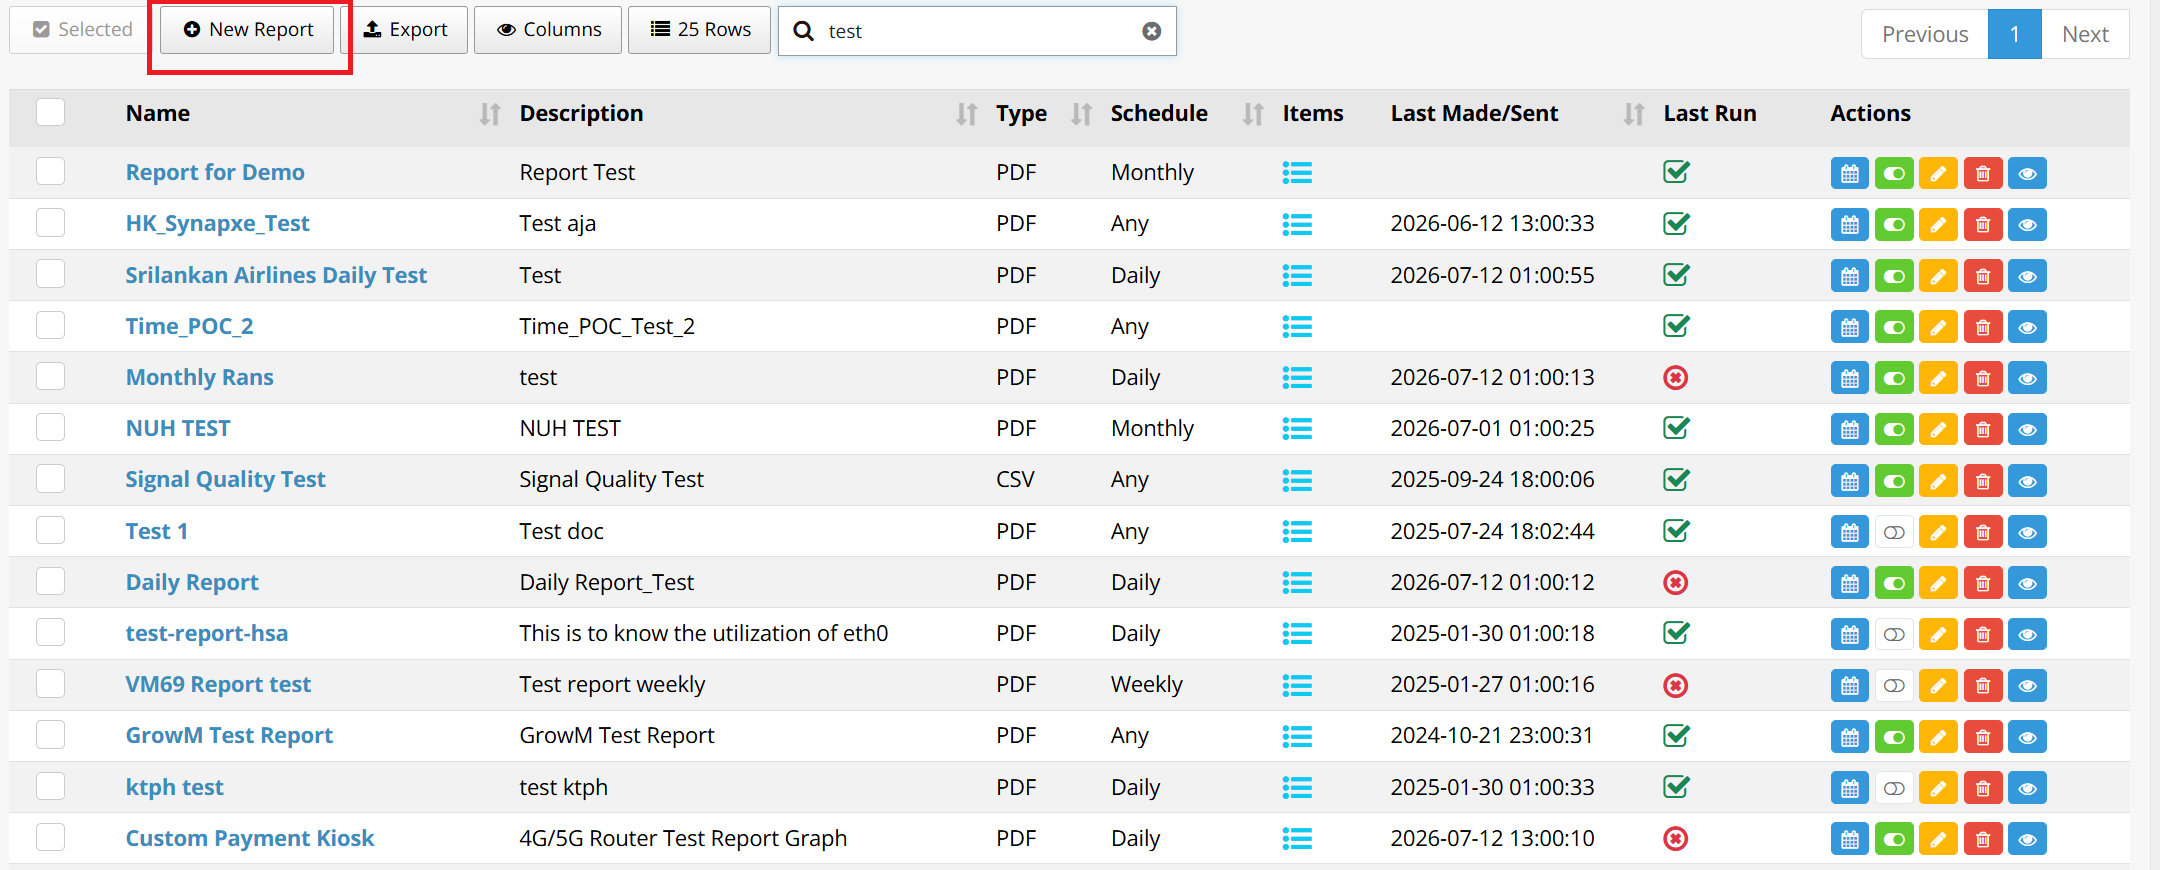
| Column | Description |
|---|---|
| Name | Report name. Click to open and edit the report definition. |
| Description | Free-text description from the Customization tab. |
| Type | Output format — PDF or CSV. |
| Schedule | Generation schedule — Daily, Weekly, Monthly, Yearly, or Any (on demand). |
| Items | Opens the list of report items (hosts, graphs, items) included in the report. |
| Last Made/Sent | Timestamp of the most recent generation and delivery. Empty if the report has never run. |
| Last Run | Result of the last run — green check (succeeded) or red cross (failed). |
| Actions | Per-report actions: generate now, enable/disable, edit, delete, and preview. |
Use the toolbar to search reports by name, adjust visible columns, or export the report list.
Create a New Report
Click New Report. The report definition is organized into three tabs — Configuration (what, when, and where to send), Customization (branding and layout), and Items (report content). Complete all three, then click Save.
Step 1: Configuration
Under the Configuration tab, define the report schedule and delivery:
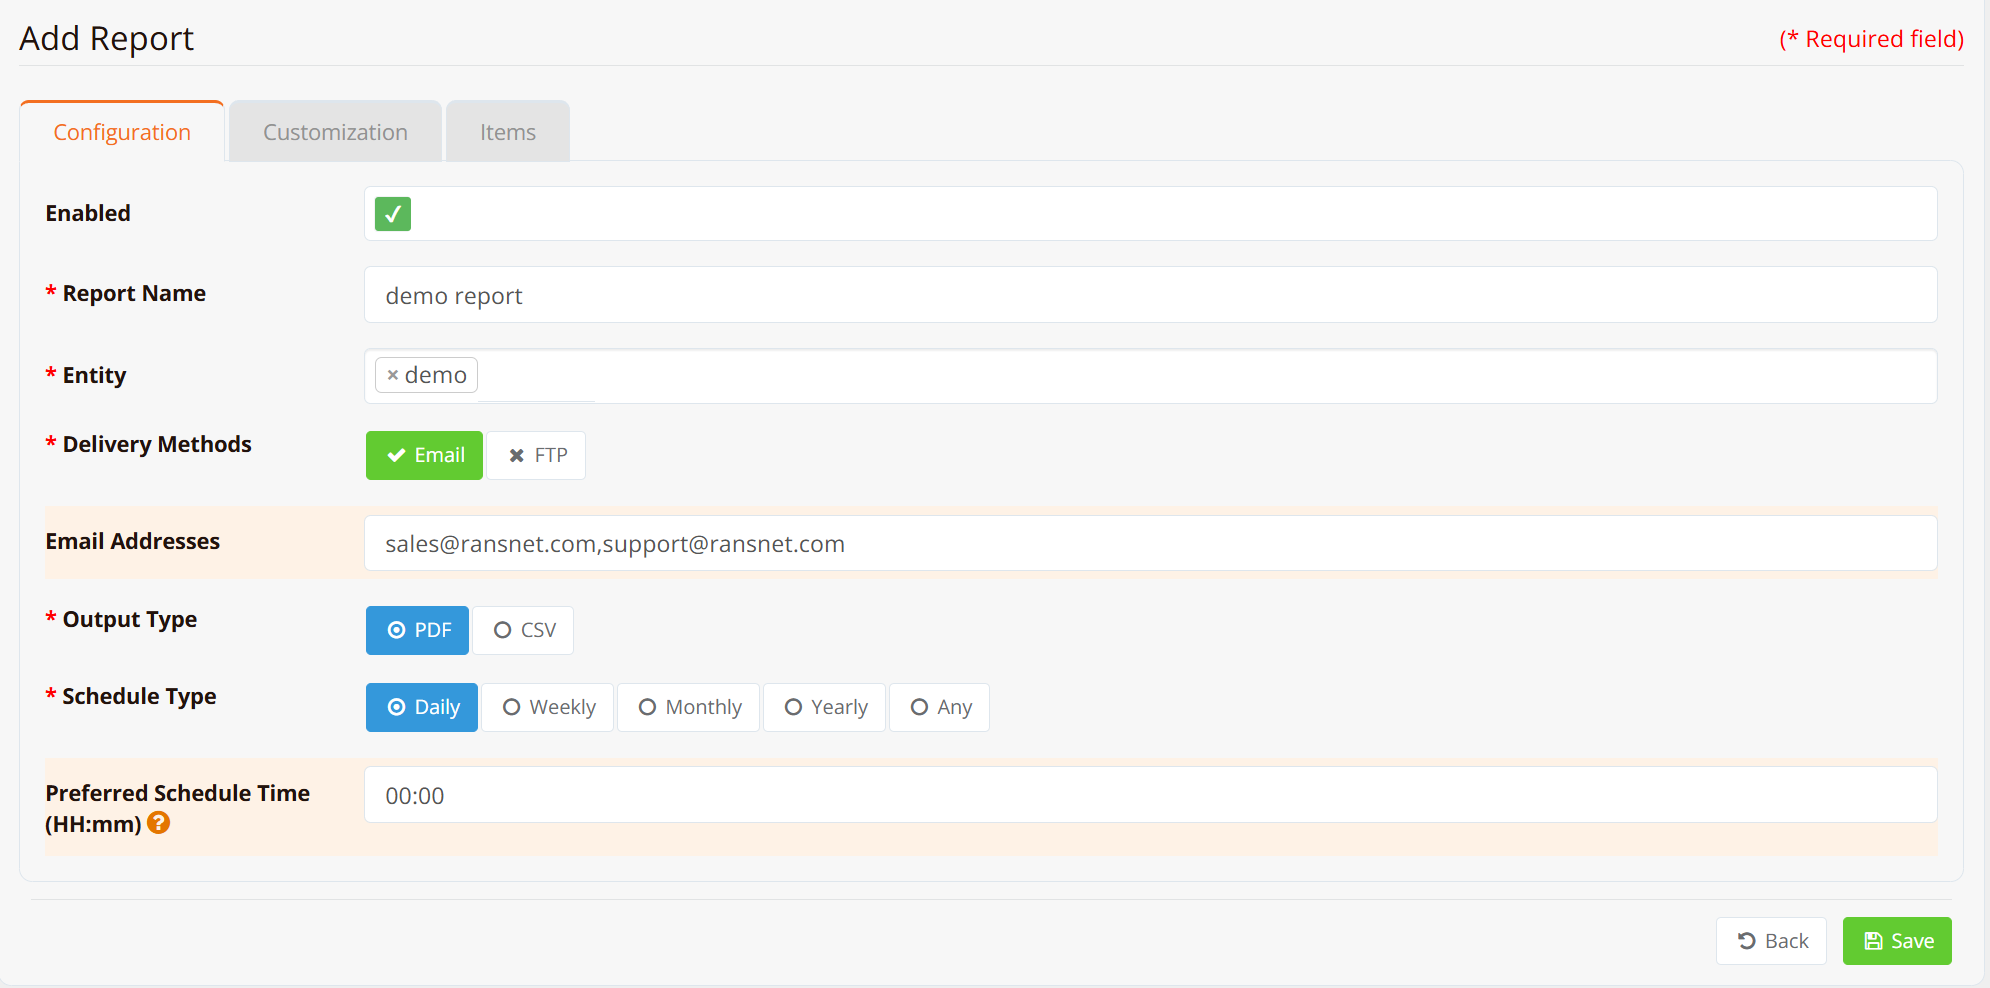
| Field | Example | Description |
|---|---|---|
| Enabled | ✓ | Enable or disable this report. Disabled reports keep their definition but are not generated. |
| Report Name | demo report |
Display name shown in the reports list. Required. |
| Entity | demo |
The tenant/entity this report belongs to. Only hosts from this entity can be added under the Items tab. Required. |
| Delivery Methods | Email |
How the generated report is delivered — Email, FTP, or both. Required. |
| Email Addresses | sales@ransnet.com,support@ransnet.com |
Recipient list for email delivery. |
| Output Type | PDF |
Report format — PDF (formatted document with graphs) or CSV (raw data for further processing). Required. |
| Schedule Type | Daily |
Generation frequency — Daily, Weekly, Monthly, Yearly, or Any (no fixed schedule; generate on demand from the reports list). Required. |
| Preferred Schedule Time (HH:mm) | 00:00 |
Time of day the scheduled generation starts. |
Tip
To send a report to multiple recipients, separate the email addresses with commas — no spaces required, e.g. noc@example.com,manager@example.com.
Warning
Email delivery requires a working SMTP server configuration on mfusion. If SMTP is not yet set up, configure it first — see Admin Settings — SMTP.
Step 2: Customization
Under the Customization tab, set the report description and branding:
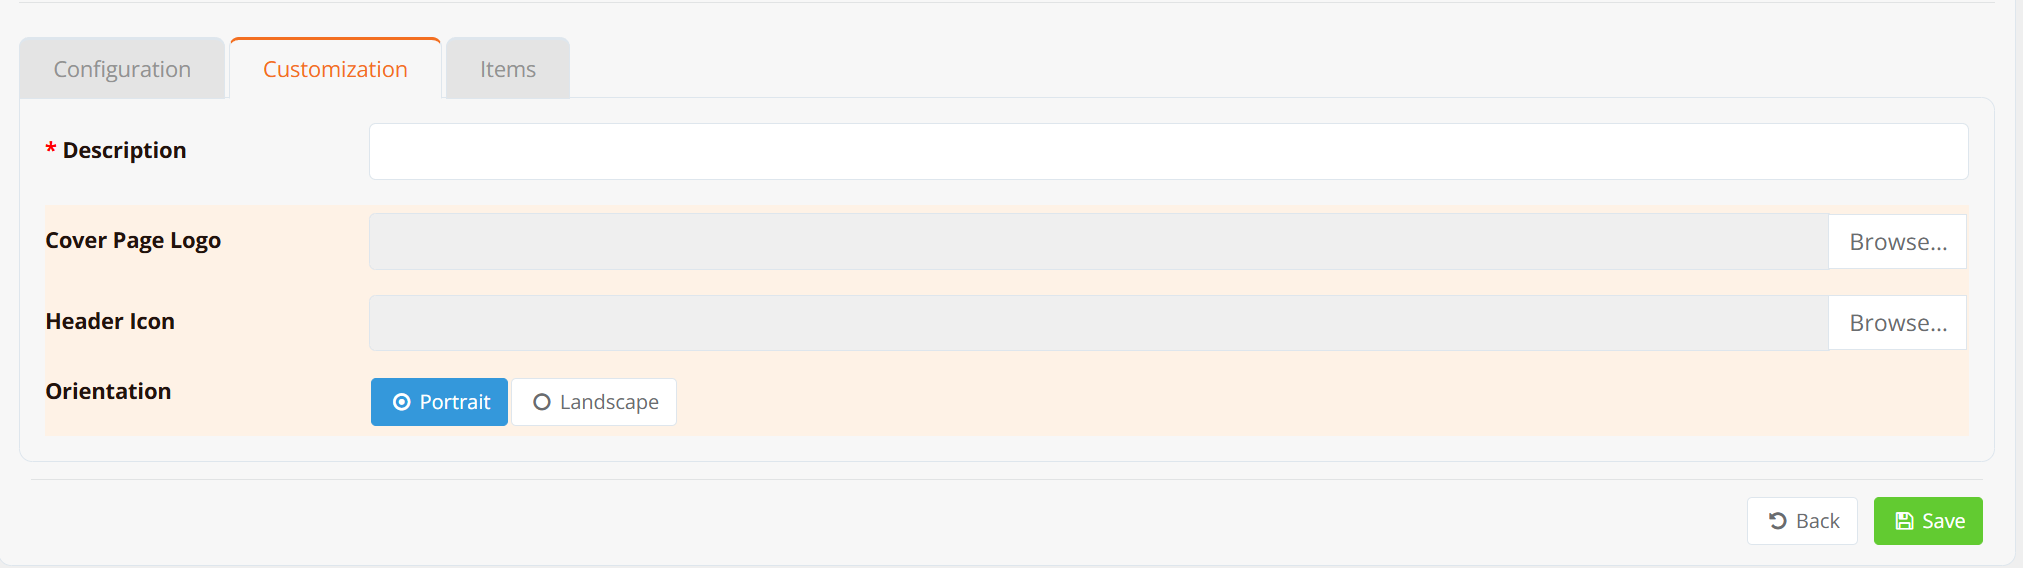
| Field | Description |
|---|---|
| Description | Free-text description shown in the reports list and on the report. Required. |
| Cover Page Logo | Optional white-label logo displayed on the report cover page — use your own or your customer's branding instead of the default. |
| Header Icon | Optional icon displayed in the page header of the report. |
| Orientation | Page orientation for PDF output — Portrait or Landscape. Choose Landscape for reports with wide graphs. |
Tip
For service providers, uploading the customer's logo as the cover page logo produces a fully white-labeled report — ready to forward without editing.
Step 3: Items
Under the Items tab, define the report content. Click Add Report Items, then select the source, type, hosts, and the graphs or items to include:
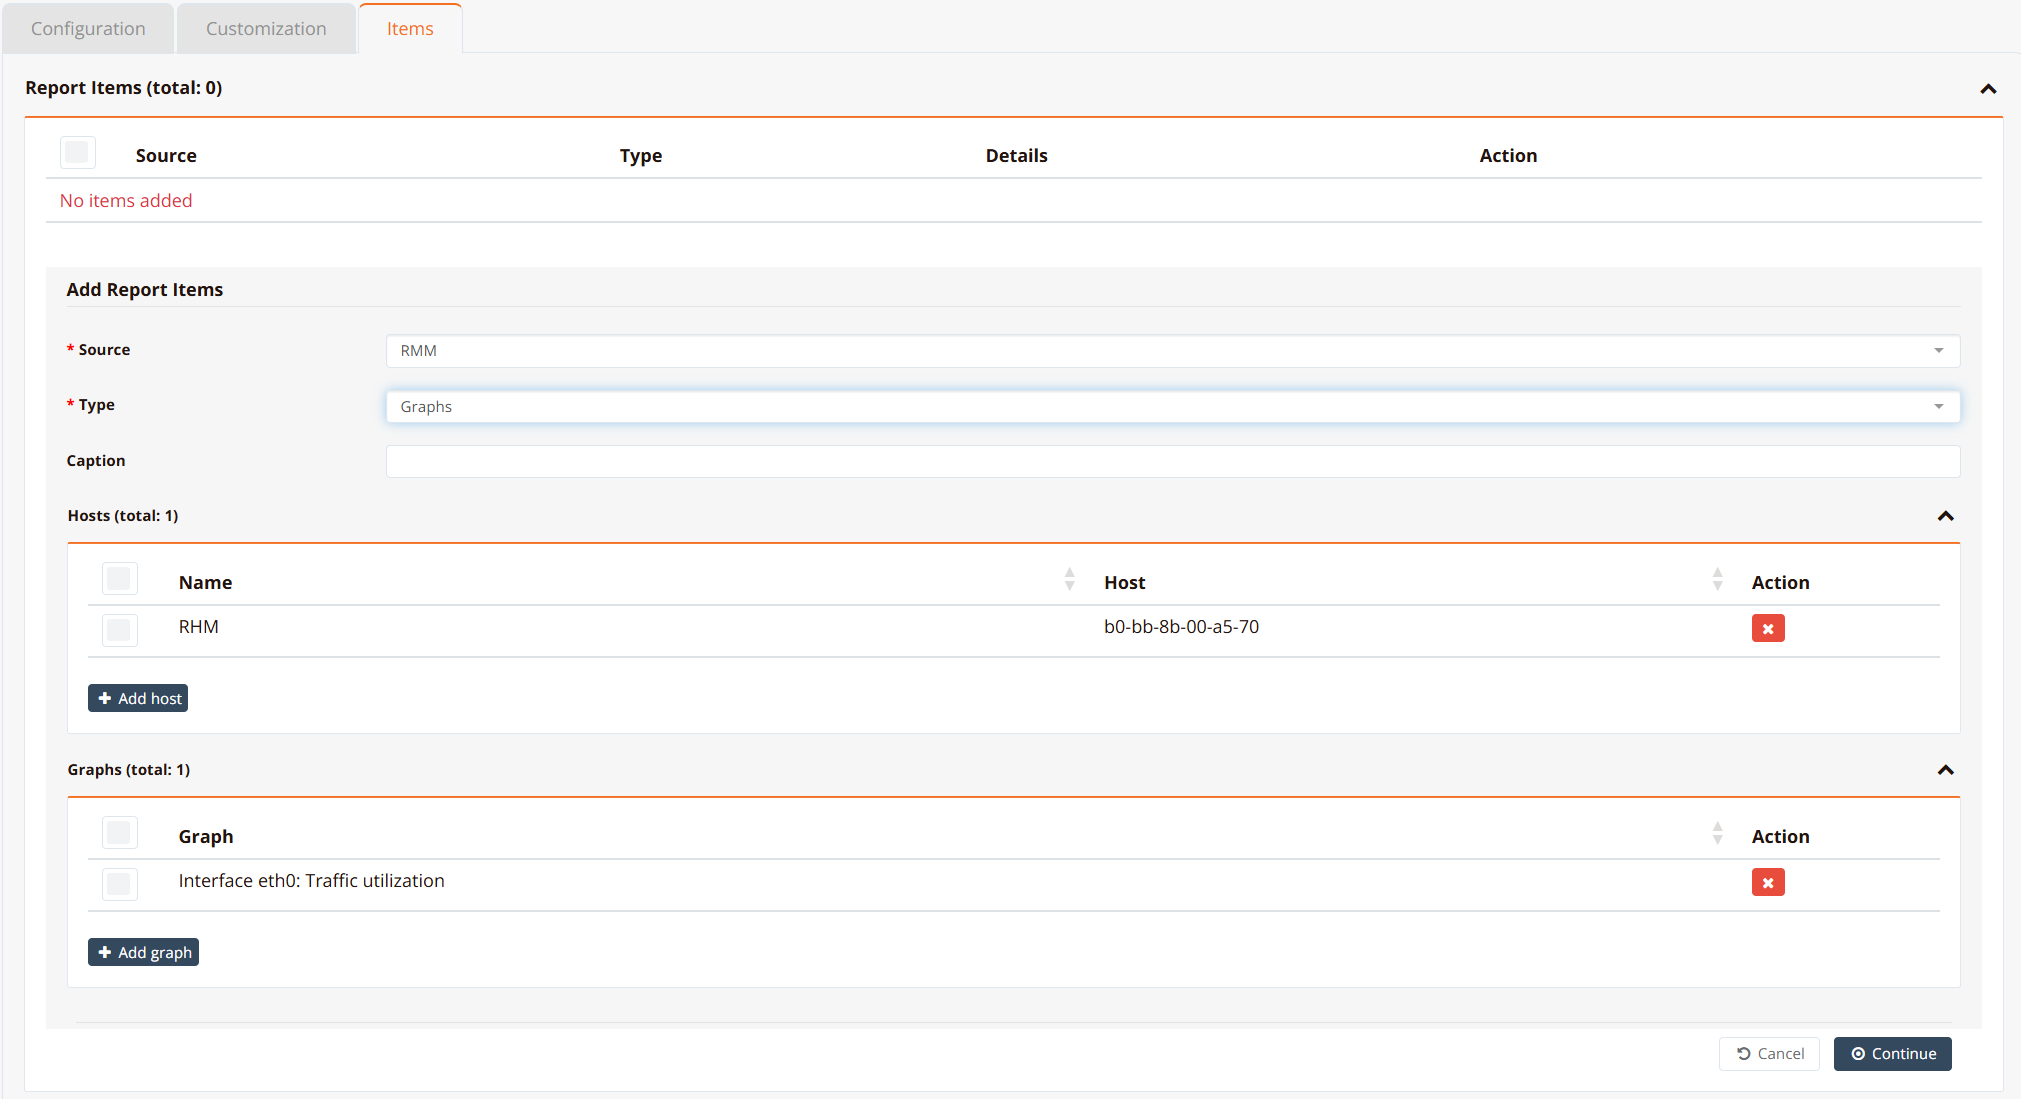
| Field | Example | Description |
|---|---|---|
| Source | RMM |
Data source for this report item. Required. |
| Type | Graphs |
Content type — Graphs (rendered charts) or Items (metric values). Required. |
| Caption | — | Optional caption displayed above this item in the report. |
| Hosts | RHM |
The device(s) this item reports on. Click Add host to select — only hosts belonging to the entity chosen under the Configuration tab are listed. |
| Graphs / Items | Interface eth0: Traffic utilization |
The graphs or items to include for the selected hosts. Click Add graph / Add item to select. |
Click Continue to add the entry, then repeat to build up the full report — you can combine multiple hosts and multiple graphs/items in the same report.
Note
Graphs and items only appear for selection (and only contain data) if the underlying monitoring items are enabled on the host. If an expected graph or item is missing, enable it first — see Mass Update — Items and Triggers.
Verification
| Items to Test | Where | Expected Outcome |
|---|---|---|
| Report generates on schedule | Reports list → Last Made/Sent | Timestamp updates at the configured schedule time; Last Run shows a green check. |
| Report delivers by email | Recipient mailbox | Each address in the comma-separated list receives the PDF/CSV attachment shortly after generation. |
| Report content is complete | Open the generated PDF/CSV | Every configured host and graph/item appears with data for the reporting period; cover logo and orientation match the Customization tab. |
| On-demand generation | Reports list → Actions | A report with schedule Any generates immediately when triggered manually. |
Troubleshooting
| Symptom | Likely Cause | Solution |
|---|---|---|
| Expected graph or item is not selectable under the Items tab | The monitoring item is disabled on the host | Enable the item (individually or in bulk) — see Mass Update — Items and Triggers. |
| A host does not appear in the Add host list | The host belongs to a different entity than the one selected under the Configuration tab | Set the correct Entity in the Configuration tab, or move the host to the intended entity. |
| Last Run shows a red cross | Generation or delivery failed — commonly an unreachable email/FTP destination or no data for the period | Verify the delivery settings (addresses, FTP details), confirm the included hosts are monitored and reachable, then re-run the report manually. |
| Report is generated but not received by email | SMTP server not configured (or misconfigured), recipient list formatting, or the mail was filtered | Verify the SMTP configuration, confirm addresses are comma-separated with no typos, and check the recipient's spam/junk folder. |
| Graphs in the report are empty | The items were enabled only recently, so no historical data exists for the period | Wait for a full reporting period after enabling the items, then check the next scheduled run. |
Related Features
- Monitoring Settings — enable items and triggers, manage templates and hosts
- Monitoring Hosts — browse per-host items and graphs included in reports
- Alerts — real-time notifications, complementing scheduled reporting