Monitoring Dashboard
The Monitoring Dashboard is the landing page of mfusion monitoring — an at-a-glance, auto-refreshing view of device health and performance across the selected entity. The dashboard is organized into five tabs, each focused on one monitoring domain:
| Tab | Purpose |
|---|---|
| Overview | Fleet-wide host status, key host graphs, and problem summary (this page) |
| Wireless | Wi-Fi visibility — APs, SSIDs, and client signal quality |
| Netflow | Traffic analytics (NOC view) and security analytics (SOC view) |
| Mobile | Cellular 4G/5G visibility — SIM state, provider, and signal quality |
| IoT | IoT sensor visibility — smart energy and environmental sensors |
Navigate to ORCHESTRATOR → Monitoring → Dashboard. Use the [Entity] button in the top-right corner to scope all tabs to a specific customer or site.
Global controls (top-right, apply across tabs):
| Control | Description |
|---|---|
| Refresh ON / interval | Toggle auto-refresh and select the refresh interval (e.g., 5 minutes). The last refresh time is shown above the page. |
| [Entity] | Filter every tab to the selected entity. |
| Expand All / Collapse All | Expand or collapse all sections on the current tab. |
| Customize page | Choose which sections appear on the tab. |
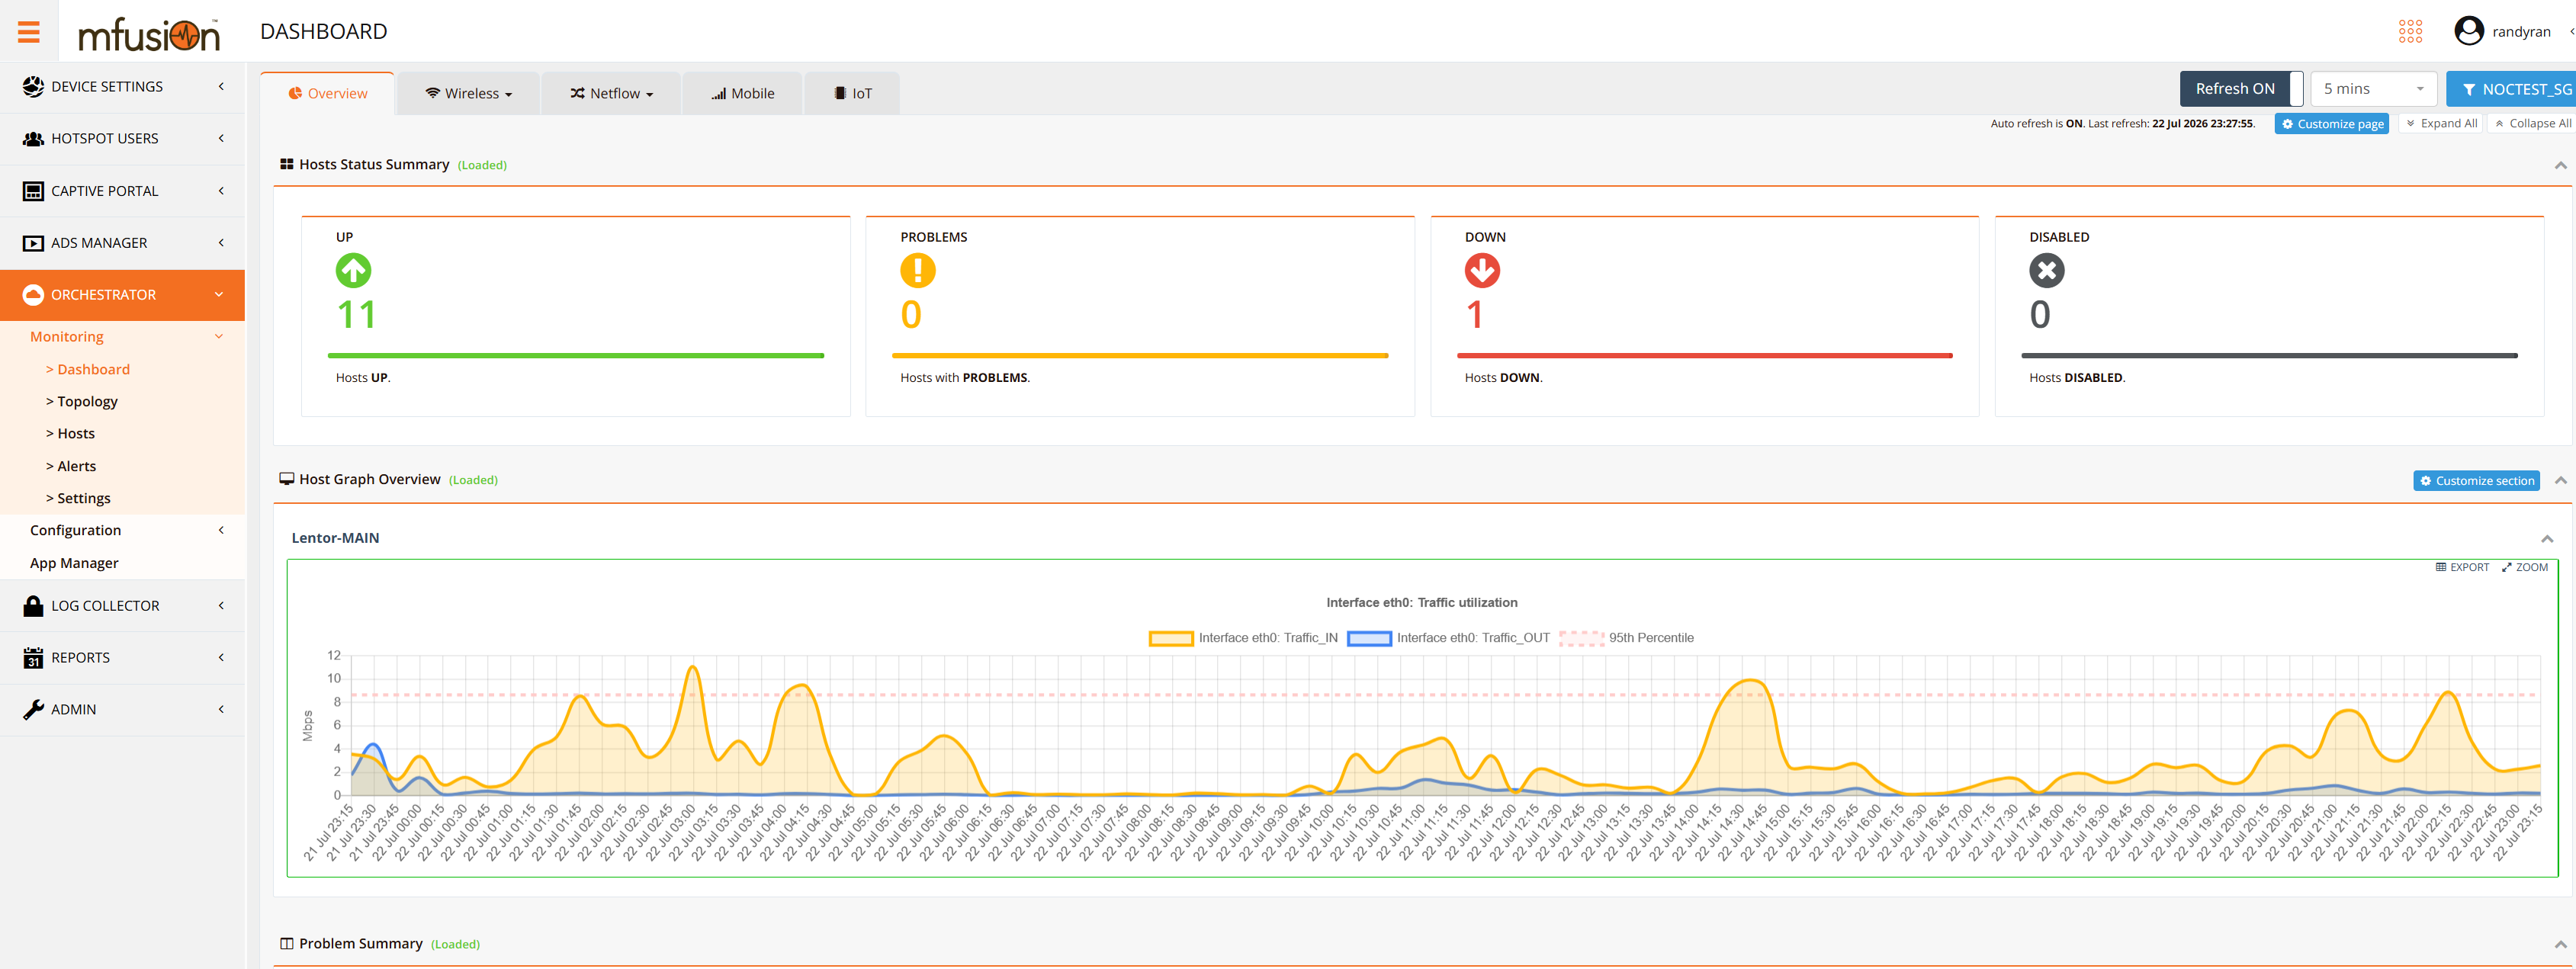
Overview Tab
The Overview tab summarizes the health of every monitored host in the entity.
Hosts Status Summary
Four status tiles count the hosts in each state:
| Tile | Meaning |
|---|---|
| UP | Hosts online and reporting normally |
| PROBLEMS | Hosts up but with active trigger conditions (e.g., threshold breaches) |
| DOWN | Hosts unreachable |
| DISABLED | Hosts administratively disabled from monitoring |
Host Graph Overview
Displays the selected monitoring graphs (e.g., WAN interface traffic utilization with 95th-percentile line) for your chosen hosts. Each graph supports Export and Zoom.
Problem Summary
Lists active problems across the entity with severity, host, and duration — the same alert data as the Alerts page, summarized for the dashboard.
Customising the Dashboard
The dashboard layout is user-configurable, and changes are saved per user — each administrator keeps a personalised view without affecting others.
- Customize page (top-right) — choose which sections are displayed on the tab.
- Customize section (on a section header, e.g., Host Graph Overview) — choose the hosts to include, then expand each host to select the monitoring items and graphs to display.
This allows targeted views — for example, a NOC screen showing only WAN traffic graphs for gateway devices at a specific site.
Troubleshooting
| Symptom | Likely Cause | Solution |
|---|---|---|
| No data displayed | Device offline or not reporting to mfusion | Check the device status under Monitoring → Hosts. |
| Graph appears empty | The selected monitoring item is disabled on that host | Open the host's Items tab under Monitoring → Hosts and enable the item — see Mass Update — Items and Triggers. |
| Section not showing | Section toggled off | Click Customize page and confirm the section is enabled. |
| Wireless / Netflow / Mobile / IoT tab shows no data | The underlying discovery rules or collectors are not enabled for the entity's hosts | See the respective tab pages: Wireless, Netflow, Mobile, IoT. |