Common Troubleshooting Tools
RansNet routers include several built-in tools for diagnosing network connectivity, performance, and quality issues. These tools help troubleshoot end-to-end connectivity, measure link quality (latency and packet loss), test throughput, and monitor network performance.
Tool Overview
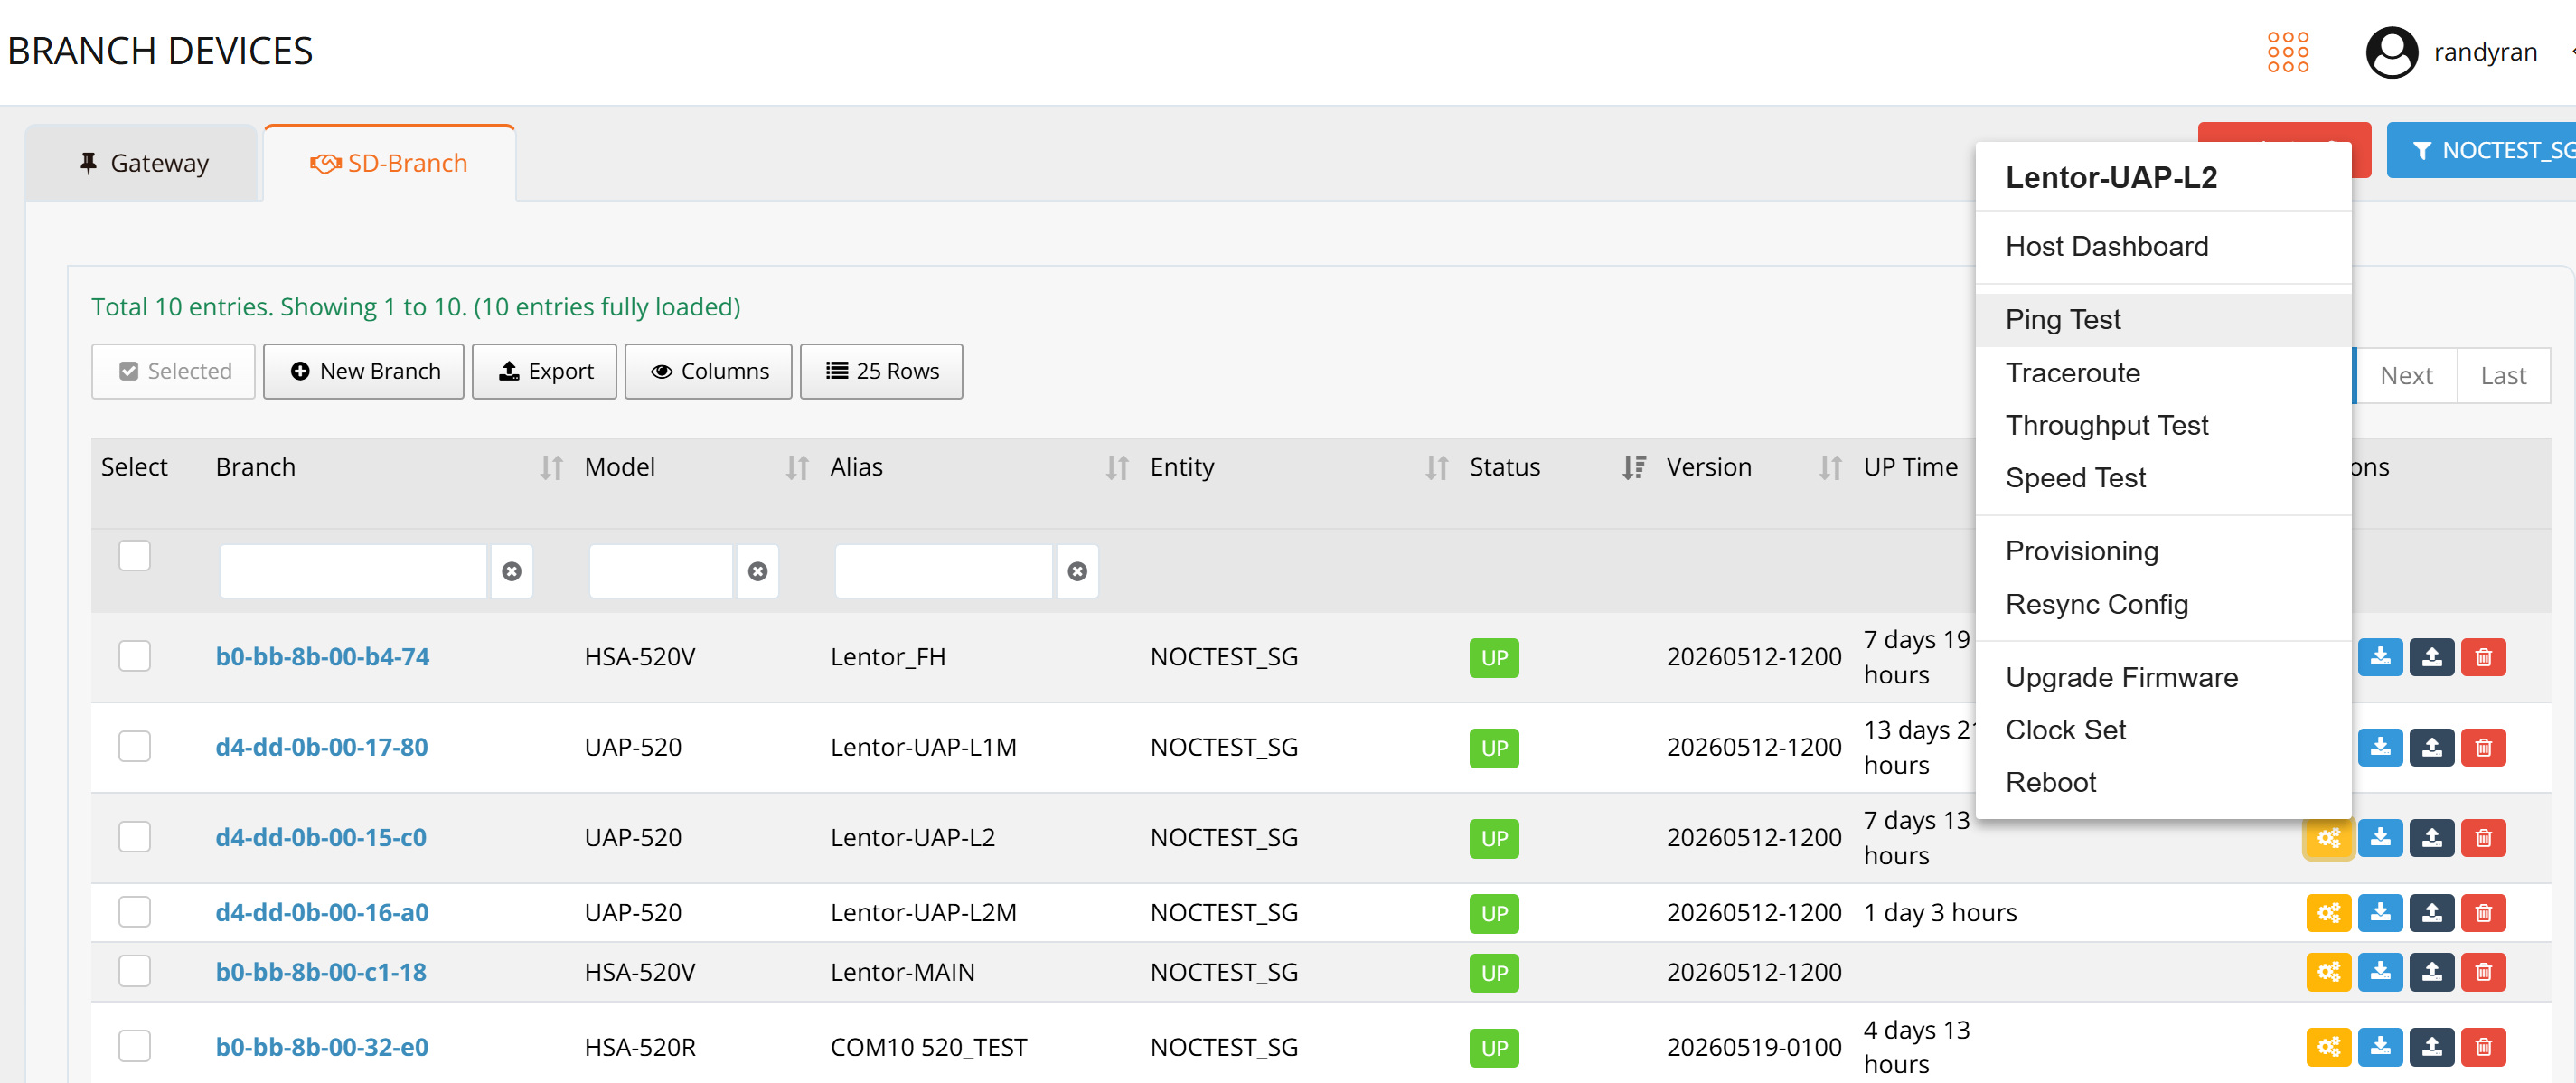
Navigate to Device List, click the yellow Tools button to access the following diagnostic tools:
| Tool | Purpose |
|---|---|
| Ping | Test end-to-end connectivity and measure quality (packet loss, latency) |
| Traceroute | Display the network path and hop-by-hop latency to a destination |
| Throughput Test | Measure data transfer rate using iperf3 (requires remote iperf3 server) |
| Speed Test | Check Internet link speed via cloud-based speed test server |
| TWAMP | RFC 5357 protocol for active network performance measurement (latency, jitter, packet loss) |
| tcpdump | Capture and analyze live network packets to troubleshoot packet flow at each hop |
| Upgrade Firmware | Update device firmware |
| Reboot | Reboot the device |
Ping
Ping tests end-to-end connectivity and quality metrics (packet loss, latency, jitter).
GUI Usage
Click Ping in the tools menu, enter a destination IP address or FQDN, and click Run.
CLI Usage
Enter enable mode and use the ping command:
RansNet# ping 1.1.1.1
  source     Source IP-address (ip) or interface (ip and arp)
  repeat     Requests to send count, default is 5
  vrf        Ping source VRF
  resolve    Resolve names
  broadcast  Ping broadcast address
  size       Packet size
  interval   The time interval between packets, default is 1
  flood      Flood ping
  <cr>
Example
RansNet# ping 1.1.1.1 source 10.18.18.1
PING 1.1.1.1 (1.1.1.1) from 10.18.18.1: 56 data bytes
64 bytes from 1.1.1.1: seq=0 ttl=59 time=2.550 ms
64 bytes from 1.1.1.1: seq=1 ttl=59 time=2.176 ms
64 bytes from 1.1.1.1: seq=2 ttl=59 time=2.621 ms
64 bytes from 1.1.1.1: seq=3 ttl=59 time=2.977 ms
64 bytes from 1.1.1.1: seq=4 ttl=59 time=2.683 ms

--- 1.1.1.1 ping statistics ---
5 packets transmitted, 5 packets received, 0% packet loss
round-trip min/avg/max = 2.176/2.601/2.977 ms
RansNet#
Tip
GUI accepts the same options as CLI. Append options directly in the GUI input field (e.g., 1.1.1.1 source 10.18.18.1).
Traceroute
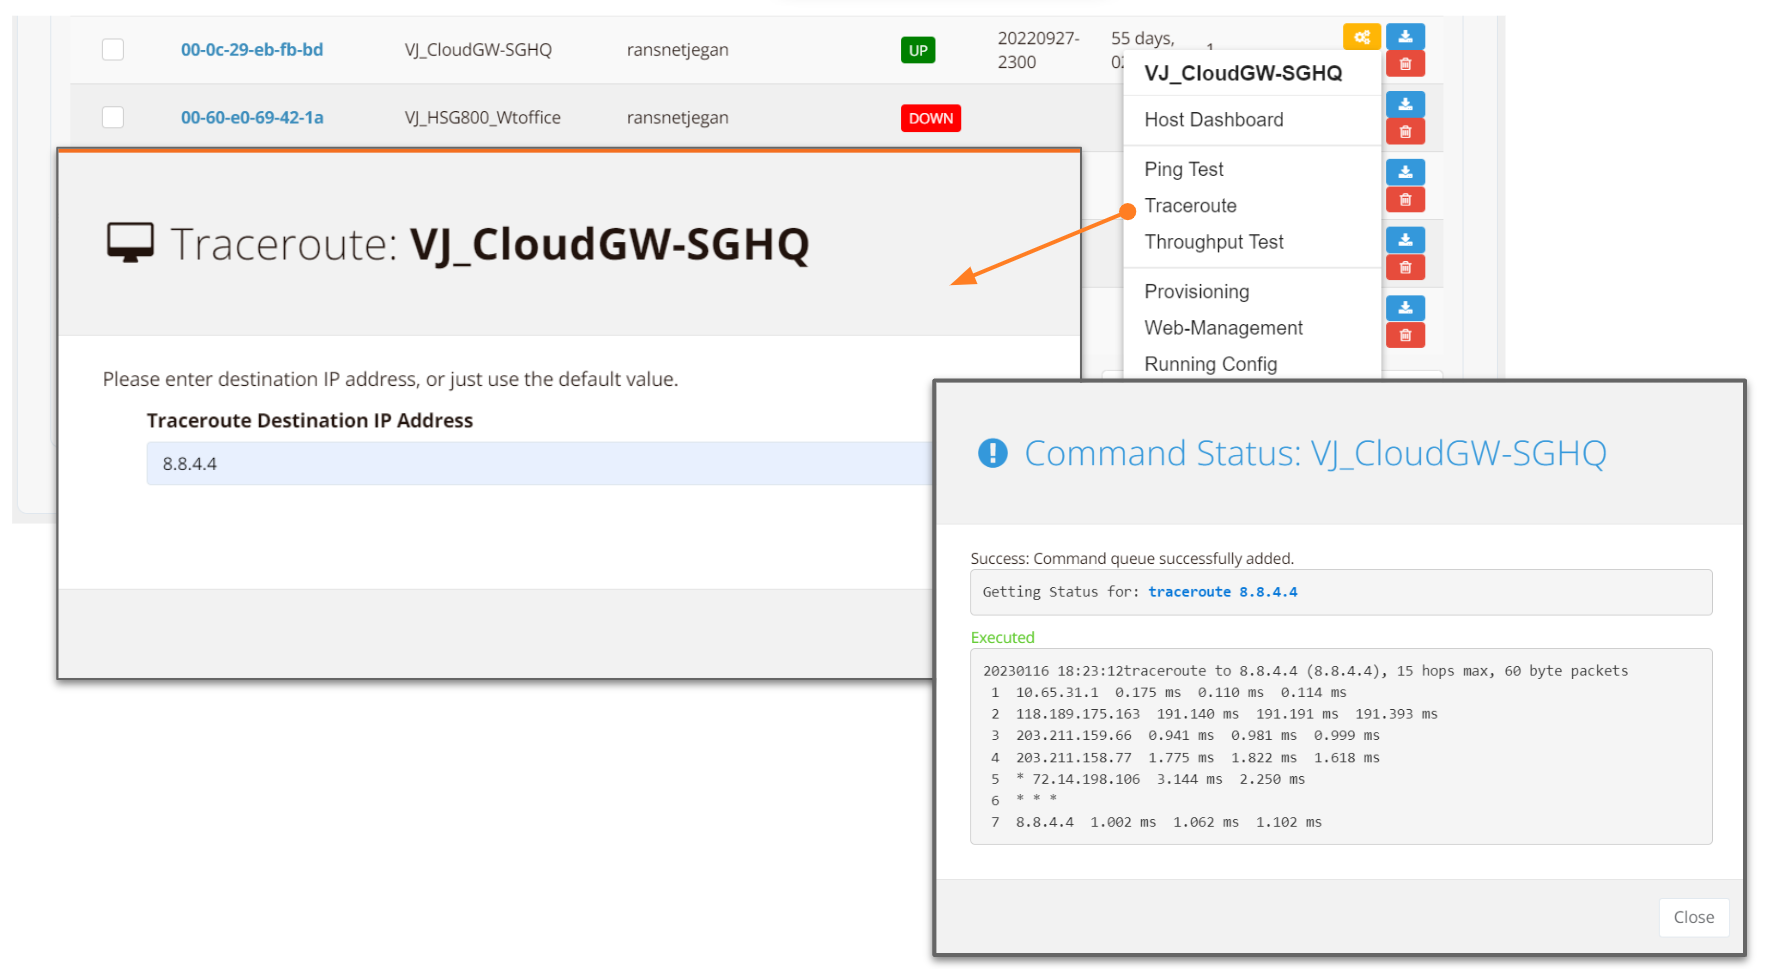
Traceroute displays the network path (hops) to a destination and measures the latency between each hop.
GUI Usage
Click Traceroute in the tools menu, enter a destination IP address or FQDN, and click Run.
CLI Usage
Enter enable mode and use the traceroute command:
RansNet# traceroute
  ip      IPv4
  ipv6    IPv6
  String  Hostname or IP-address to trace the route

RansNet# traceroute 1.1.1.1
  resolve    Resolve names
  source     Source IP-address
  vrf        Source VRF
  interface  Source interface
  <cr>
Example
RansNet# traceroute 1.1.1.1
traceroute to 1.1.1.1 (1.1.1.1), 15 hops max, 38 byte packets
 1  61.13.198.165  1.146 ms  *  *
 2  10.100.11.245  1.808 ms  1.074 ms  1.291 ms
 3  *  *  *
 4  27.111.230.2  1.781 ms  27.111.228.132  1.916 ms  *
 5  *  *  172.69.117.89  4.951 ms
 6  1.1.1.1  1.639 ms  2.059 ms  *
RansNet#
Note
Hops showing * * * indicate no response (ICMP timeout). This is normal for some intermediate routers.
Speed Test
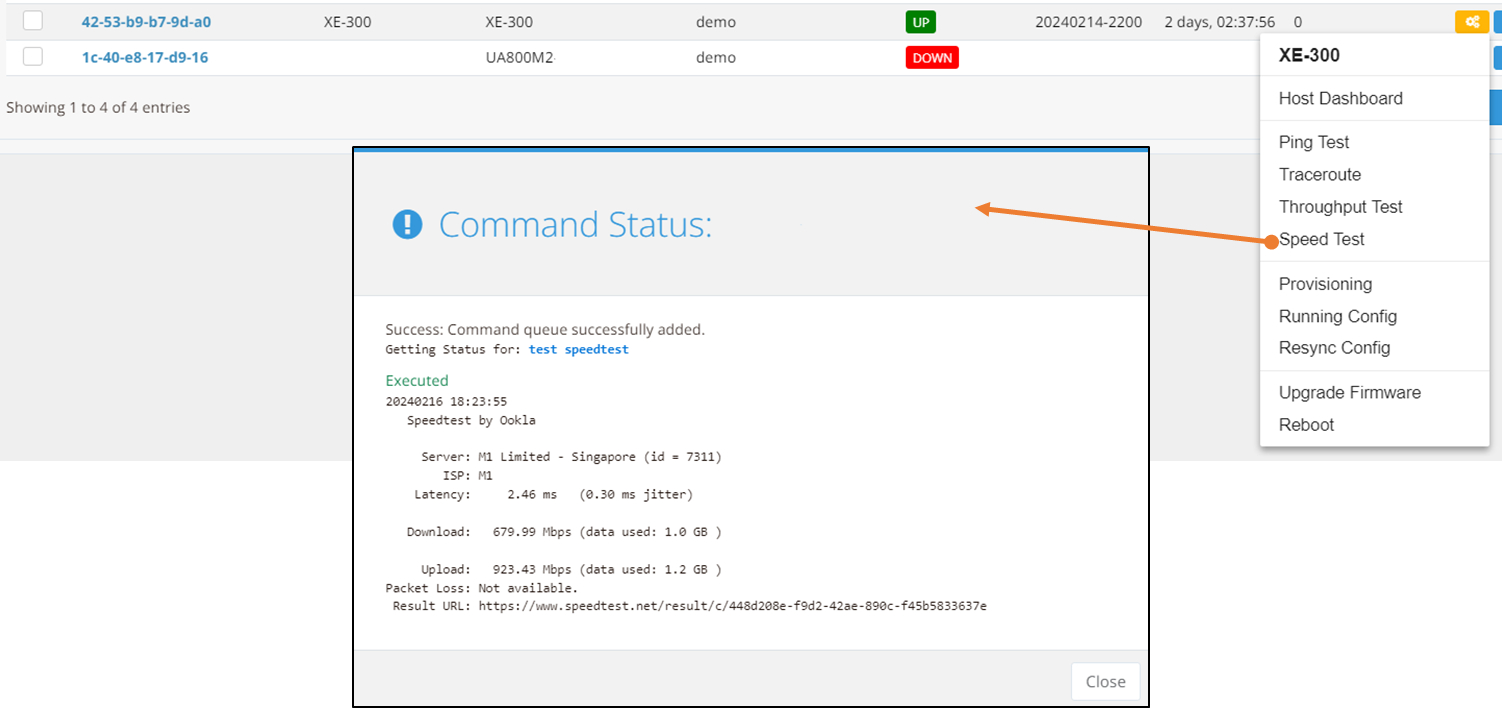
Speed Test measures your Internet link speed by connecting to a cloud-based speed test server (Ookla Speedtest).
GUI Usage
Click Speed Test in the tools menu and click Run. The test measures download speed, upload speed, latency, and packet loss.
CLI Usage
Use the test speedtest command:
RansNet# test speedtest

   Speedtest by Ookla

     Server: MyRepublic Singapore - Singapore (id = 5935)
        ISP: Sptel
    Latency:     1.46 ms   (0.78 ms jitter)
   Download:   476.84 Mbps (data used: 346.9 MB )
     Upload:   938.77 Mbps (data used: 1.3 GB )
Packet Loss:     0.0%
 Result URL: https://www.speedtest.net/result/c/08aae5ff-8fd8-43b5-a26d-d15ed264bc2f
RansNet#
Warning
The first time you run this test, you will be prompted to accept the Speedtest license agreement. Enter YES to proceed.
Throughput Test
Throughput Test measures data transfer rate using iperf3. It requires an iperf3 server running on a remote system (either a cloud iperf3 server or a RansNet router configured as iperf3 server).
For a list of public iperf3 servers, see iperf.fr.
Architecture
RansNet routers can act as either iperf3 server (passive measurement) or client (active measurement). In a point-to-point throughput test:
- Remote RansNet router: runs as iperf3 server
- Local RansNet router: runs as iperf3 client
Step 1: Configure Remote Router as iperf3 Server
First, configure the firewall to permit inbound iperf3 traffic:
Then start the iperf3 server:
SGNOC-GW1# test server
-----------------------------------------------------------
Server listening on 5201 (test #1)
-----------------------------------------------------------
Step 2: Run Throughput Test from Client Router
Launch the iperf3 throughput test using the test throughput command:
RansNet# test throughput 118.189.175.164
[info] getting download throughput (server send to client).
Connecting to host 118.189.175.164, port 5201
Reverse mode, remote host 118.189.175.164 is sending
[  4] local 61.13.198.166 port 56496 connected to 118.189.175.164 port 5201
[ ID] Interval           Transfer     Bandwidth
[  4]   0.00-1.00   sec  48.0 MBytes   402 Mbits/sec
[  4]   1.00-2.00   sec  46.2 MBytes   388 Mbits/sec
[  4]   2.00-3.00   sec  56.6 MBytes   476 Mbits/sec
[  4]   3.00-4.00   sec  58.7 MBytes   492 Mbits/sec
[  4]   4.00-5.00   sec  57.2 MBytes   480 Mbits/sec
[  4]   5.00-6.00   sec  57.2 MBytes   480 Mbits/sec
[  4]   6.00-7.00   sec  57.2 MBytes   480 Mbits/sec
[  4]   7.00-8.00   sec  57.2 MBytes   480 Mbits/sec
[  4]   8.00-9.00   sec  57.2 MBytes   480 Mbits/sec
[  4]   9.00-10.00  sec  56.9 MBytes   477 Mbits/sec
- - - - - - - - - - - - - - - - - - - - - - - - -
[ ID] Interval           Transfer     Bandwidth       Retr
[  4]   0.00-10.00  sec   558 MBytes   468 Mbits/sec  609             sender
[  4]   0.00-10.00  sec   553 MBytes   464 Mbits/sec                  receiver

iperf Done.
[info] getting upload throughput (client send to server).
Connecting to host 118.189.175.164, port 5201
[  4] local 61.13.198.166 port 56574 connected to 118.189.175.164 port 5201
[ ID] Interval           Transfer     Bandwidth       Retr  Cwnd
[  4]   0.00-1.00   sec  16.1 MBytes   135 Mbits/sec   27    252 KBytes
[  4]   1.00-2.00   sec  15.8 MBytes   133 Mbits/sec    1    221 KBytes
[  4]   2.00-3.00   sec  15.7 MBytes   132 Mbits/sec    5    190 KBytes
[  4]   3.00-4.00   sec  15.5 MBytes   130 Mbits/sec    0    247 KBytes
[  4]   4.00-5.00   sec  15.9 MBytes   134 Mbits/sec    1    220 KBytes
[  4]   5.00-6.00   sec  15.6 MBytes   131 Mbits/sec    6    187 KBytes
[  4]   6.00-7.00   sec  15.9 MBytes   133 Mbits/sec    0    244 KBytes
[  4]   7.00-8.00   sec  16.0 MBytes   134 Mbits/sec   13    204 KBytes
[  4]   8.00-9.00   sec  15.7 MBytes   132 Mbits/sec    0    258 KBytes
[  4]   9.00-10.00  sec  15.6 MBytes   131 Mbits/sec    1    232 KBytes
- - - - - - - - - - - - - - - - - - - - - - - - -
[ ID] Interval           Transfer     Bandwidth       Retr
[  4]   0.00-10.00  sec   158 MBytes   132 Mbits/sec   54             sender
[  4]   0.00-10.00  sec   157 MBytes   132 Mbits/sec                  receiver

iperf Done.
RansNet#
TWAMP
TWAMP (Two-Way Active Measurement Protocol) is a standards-based protocol defined in RFC 5357 for actively measuring IP network performance metrics (latency, jitter, packet loss) between two endpoints.
RansNet routers can function as either TWAMP server (responder) or client (initiator).
Step 1: Enable TWAMP Server on Remote Router
Start the TWAMP server:
SGNOC-GW1# twping server start
Starting twamp-server (via systemctl): twamp-server.service.
SGNOC-GW1#
Configure firewall rules to permit TWAMP traffic:
- TCP port 862 (control channel)
- UDP ports 18760-19960 (data channels)
Server mode options:
# Start server on default port 862
twping server start

# Start on custom port
twping server start port 5000

# Start on specific address
twping server start address 192.168.1.1

# Check server status
twping server status

# Stop server
twping server stop

# Shorthand (start is default)
twping server
Step 2: Run TWAMP Client on Test Router
Launch the TWAMP client test:
VM53-Demo-Data1# twping client 118.189.175.164

Session ID: 76bdafa4edbc59aa939ab58df0c46b82
76bdafa4edbc59aa939ab58df0c46b82
Time:       2026-05-24T00:51:55.704 - 2026-05-24T00:52:03.827
Stats:      100 sent, 0 lost (0.000%), 0 send duplicates, 0 reflect duplicates
===================================================================
Direction              Min        Max         Avg      Jitter  Loss
-------------------------------------------------------------------
Send (outbound):     0.0582ms    2.72ms     0.3ms     0.6   0.000%
Reflect (inbound):   0.128ms    2.15ms     0.3ms     0.2   0.000%
Roundtrip:           0.186ms     3.1ms     0.6ms     1.4   0.000%
-------------------------------------------------------------------

VM53-Demo-Data1#
Client mode options:
# Basic client test
twping client 118.189.175.164

# With custom count
twping client 118.189.175.164 repeat 200

# With source IP/interface
twping client 118.189.175.164 source 192.168.1.1

# With authentication
twping client 118.189.175.164 username testuser

# Combined
twping client 118.189.175.164 repeat 200 source eth0 username testuser
tcpdump
tcpdump captures live network packets for detailed traffic analysis. Use it to observe packet flows at each hop in the network path and identify where traffic is being dropped or blocked.
RansNet routers include tcpdump pre-installed. Run it on an interface to see live packets:
RansNet# tcpdump interface eth0 port 443
tcpdump: verbose output suppressed, use -v or -vv for full protocol decode
listening on eth0, link-type EN10MB (Ethernet), capture size 262144 bytes
13:10:04.814948 IP 61.13.198.166.59874 > 118.189.175.168.443: Flags [S], seq 2132128584, win 29200, options [mss 1460,sackOK,TS val 73030990 ecr 0,nop,wscale 6], length 0
13:10:04.820498 IP 61.13.198.166.37762 > 118.189.175.168.443: Flags [P.], seq 3045555367:3045555884, ack 3162549609, win 457, length 517
13:10:04.820984 IP 118.189.175.168.443 > 61.13.198.166.59874: Flags [S.], seq 1045307433, ack 2132128585, win 42340, options [mss 1460,nop,nop,sackOK,nop,wscale 9], length 0
13:10:04.824429 IP 61.13.198.166.59874 > 118.189.175.168.443: Flags [.], ack 1, win 457, length 0
13:10:04.824680 IP 61.13.198.166.59874 > 118.189.175.168.443: Flags [F.], seq 1, ack 1, win 457, length 0
13:10:04.824912 IP 61.13.198.166.59874 > 118.189.175.168.443: Flags [R.], seq 2, ack 1, win 457, length 0
13:10:04.828595 IP 118.189.175.168.443 > 61.13.198.166.37762: Flags [.], ack 517, win 83, length 0
13:10:04.898689 IP 61.13.198.166.51570 > 13.204.106.34.443: Flags [.], ack 4108510905, win 251, length 0
CLI Usage
RansNet# tcpdump interface eth0 port 443
  host    View output by specific source or destination host
  filter  Filter output by expression (e.g., src 192.168.1.1)
  detail  Display full packet details (header and payload)
  vrf     Run tcpdump within a specific VRF
  <cr>
Example: Troubleshooting Packet Flow
When packets aren't reaching their destination, use tcpdump at each hop to identify where they're being dropped or blocked. Follow this decision tree:
flowchart TD
    A["Run tcpdump on incoming interface<br/>(expected source side)"] --> B{"Packets<br/>arriving?"}
    B -->|No| C["Check upstream routing<br/>and accessibility"]
    B -->|Yes| D["Run tcpdump on outgoing interface<br/>(expected destination side)"]
    D --> E{"Packets<br/>leaving?"}
    E -->|No| F["Check:<br/>• Firewall rules permit access?<br/>• Routing table has route<br/>to destination?"]
    E -->|Yes| G{"Receiving<br/>reply packets?"}
    G -->|No| H["Check:<br/>• Firewall rules for return traffic<br/>  (SNAT/translation)?<br/>• Upstream routing has route<br/>  back to source IP?"]
    G -->|Yes| I["Check downstream device<br/>(next-hop router/firewall)<br/>blocking return path"]

    C --> J["Problem found on<br/>upstream path"]
    F --> K["Problem found on<br/>local router"]
    H --> L["Problem found on<br/>upstream path"]
    I --> M["Problem found on<br/>downstream path"]

    style J fill:#ffcccc
    style K fill:#ffcccc
    style L fill:#ffcccc
    style M fill:#ffcccc
Troubleshooting methodology:
- Incoming interface — Verify traffic arrives from the source. Use filters (e.g.,
host 192.168.1.1) to isolate specific flows. -
If packets don't arrive, the problem is upstream (check routing and reachability to your router).
-
Outgoing interface — Verify traffic leaves toward the destination.
-
If packets don't leave, check local firewall rules and routing table.
-
Return packets — Verify replies come back.
-
If no replies arrive, check firewall translation rules (SNAT) and upstream routing for the reverse path.
-
Repeat on each hop — Walk through each router/firewall in the end-to-end path using the same method. This narrows the problem to a specific device.
Repeat the same approach on each hop/router in between the end-to-end path, you can easily isolate to the "problem" hop/router and discover the root cause.