NetFlow Traffic Analysis
NetFlow is an industry-standard network telemetry protocol (originally developed by Cisco) that enables network devices to export metadata about IP traffic flows as they pass through an interface. Each flow record captures key attributes of a traffic session — source and destination IP, source and destination port, protocol, byte and packet counts, timestamps, and interface — without capturing the actual packet payload. This makes NetFlow highly efficient for large-scale traffic visibility while preserving user privacy.
mfusion and HSG collect NetFlow exports from RansNet devices and supported third-party network equipment using NetFlow v5 and NetFlow v9 (which also supports IPFIX-compatible templates). Collected records are stored, processed, and presented through two dashboard views: NOC (traffic analytics) and SOC (security analytics).
Navigate to ORCHESTRATOR → Monitoring → Dashboard and select the Netflow tab. Both views share a time-range selector — pick a custom From/To window or use the quick ranges (Last 1h / 3h / 6h / 12h / 24h) and click Apply.
Key Use Cases
NetFlow analysis is particularly valuable for:
- Bandwidth accounting — Understand which users, devices, applications, or destinations consume the most bandwidth
- Security investigation — Identify anomalous traffic patterns, unauthorized connections, or data exfiltration attempts
- Capacity planning — Trend traffic volumes over time to inform WAN link or hardware sizing decisions
- Dispute resolution — Provide verifiable, timestamped per-connection evidence to resolve user complaints or billing disputes
- Compliance and forensics — Maintain an auditable record of network activity for regulatory or incident response requirements
NOC View
The NOC view answers the operational questions: how much traffic, from whom, to where.
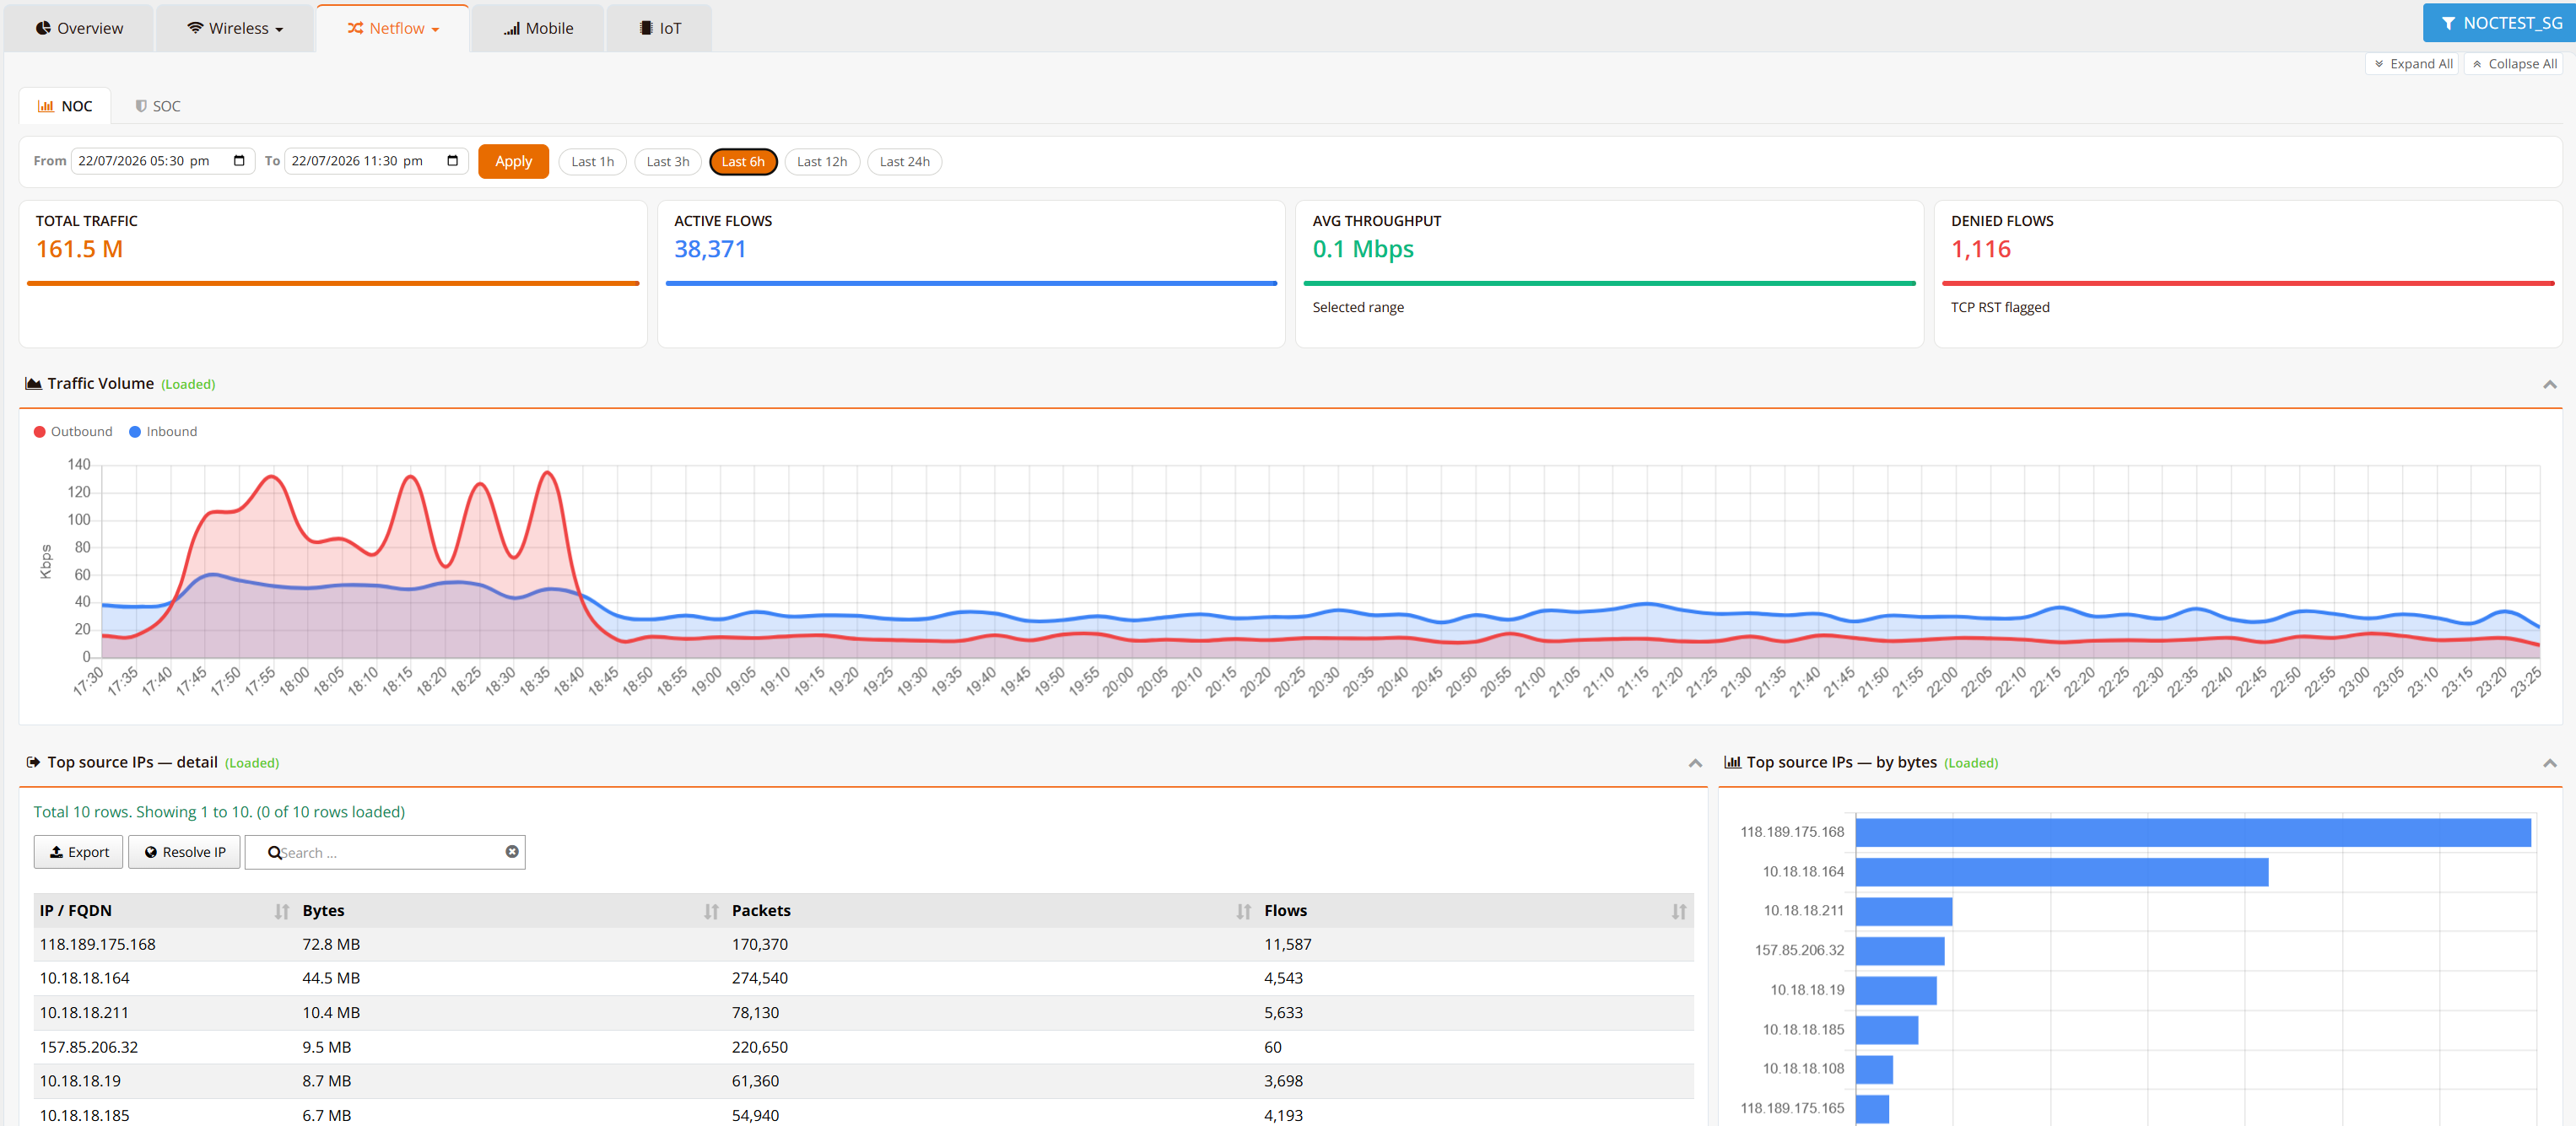
KPI tiles summarize the selected time range:
| Tile | Description |
|---|---|
| Total Traffic | Total flow volume observed in the range |
| Active Flows | Number of flow records in the range |
| Avg Throughput | Average throughput across the selected range |
| Denied Flows | Flows flagged with TCP RST — connections reset or denied |
Traffic Volume charts inbound and outbound throughput over time, making spikes and asymmetry immediately visible.
Top source IPs ranks the heaviest talkers, as a detail table (bytes, packets, flows per IP) and a by-bytes bar chart. Use Export to save the table, the search box to filter, and Resolve IP to perform reverse DNS lookups — replacing raw IPs with human-readable FQDNs (e.g., 203.0.113.5 → cdn.example.com), which makes unfamiliar or suspicious hosts stand out immediately.
Note
Reverse DNS resolution is performed on demand and depends on the availability of PTR records for the queried IPs. Not all IP addresses resolve to a meaningful hostname — in particular, many cloud and CDN providers use dynamic or non-descriptive PTR records.
Common Investigation Scenarios:
| Scenario | Action | Expected Outcome |
|---|---|---|
| User disputes data charge | Filter by the user's device IP across the billing period | Complete timestamped record of connections and data consumed |
| Security alert on suspicious connection | Filter by source host IP | Full sequence of connections before/after the alert to identify broader compromise |
| Verify firewall policy is blocking | Search for blocked destination IPs | Blocked IPs should not appear in flow records (or show very few packets) |
| WAN link saturated | Select the time window, sort top sources by bytes | Identify the responsible host and destination within seconds |
SOC View
The SOC view applies security analytics to the same flow data — purpose-built for security teams to detect, investigate, and respond to anomalous activity.
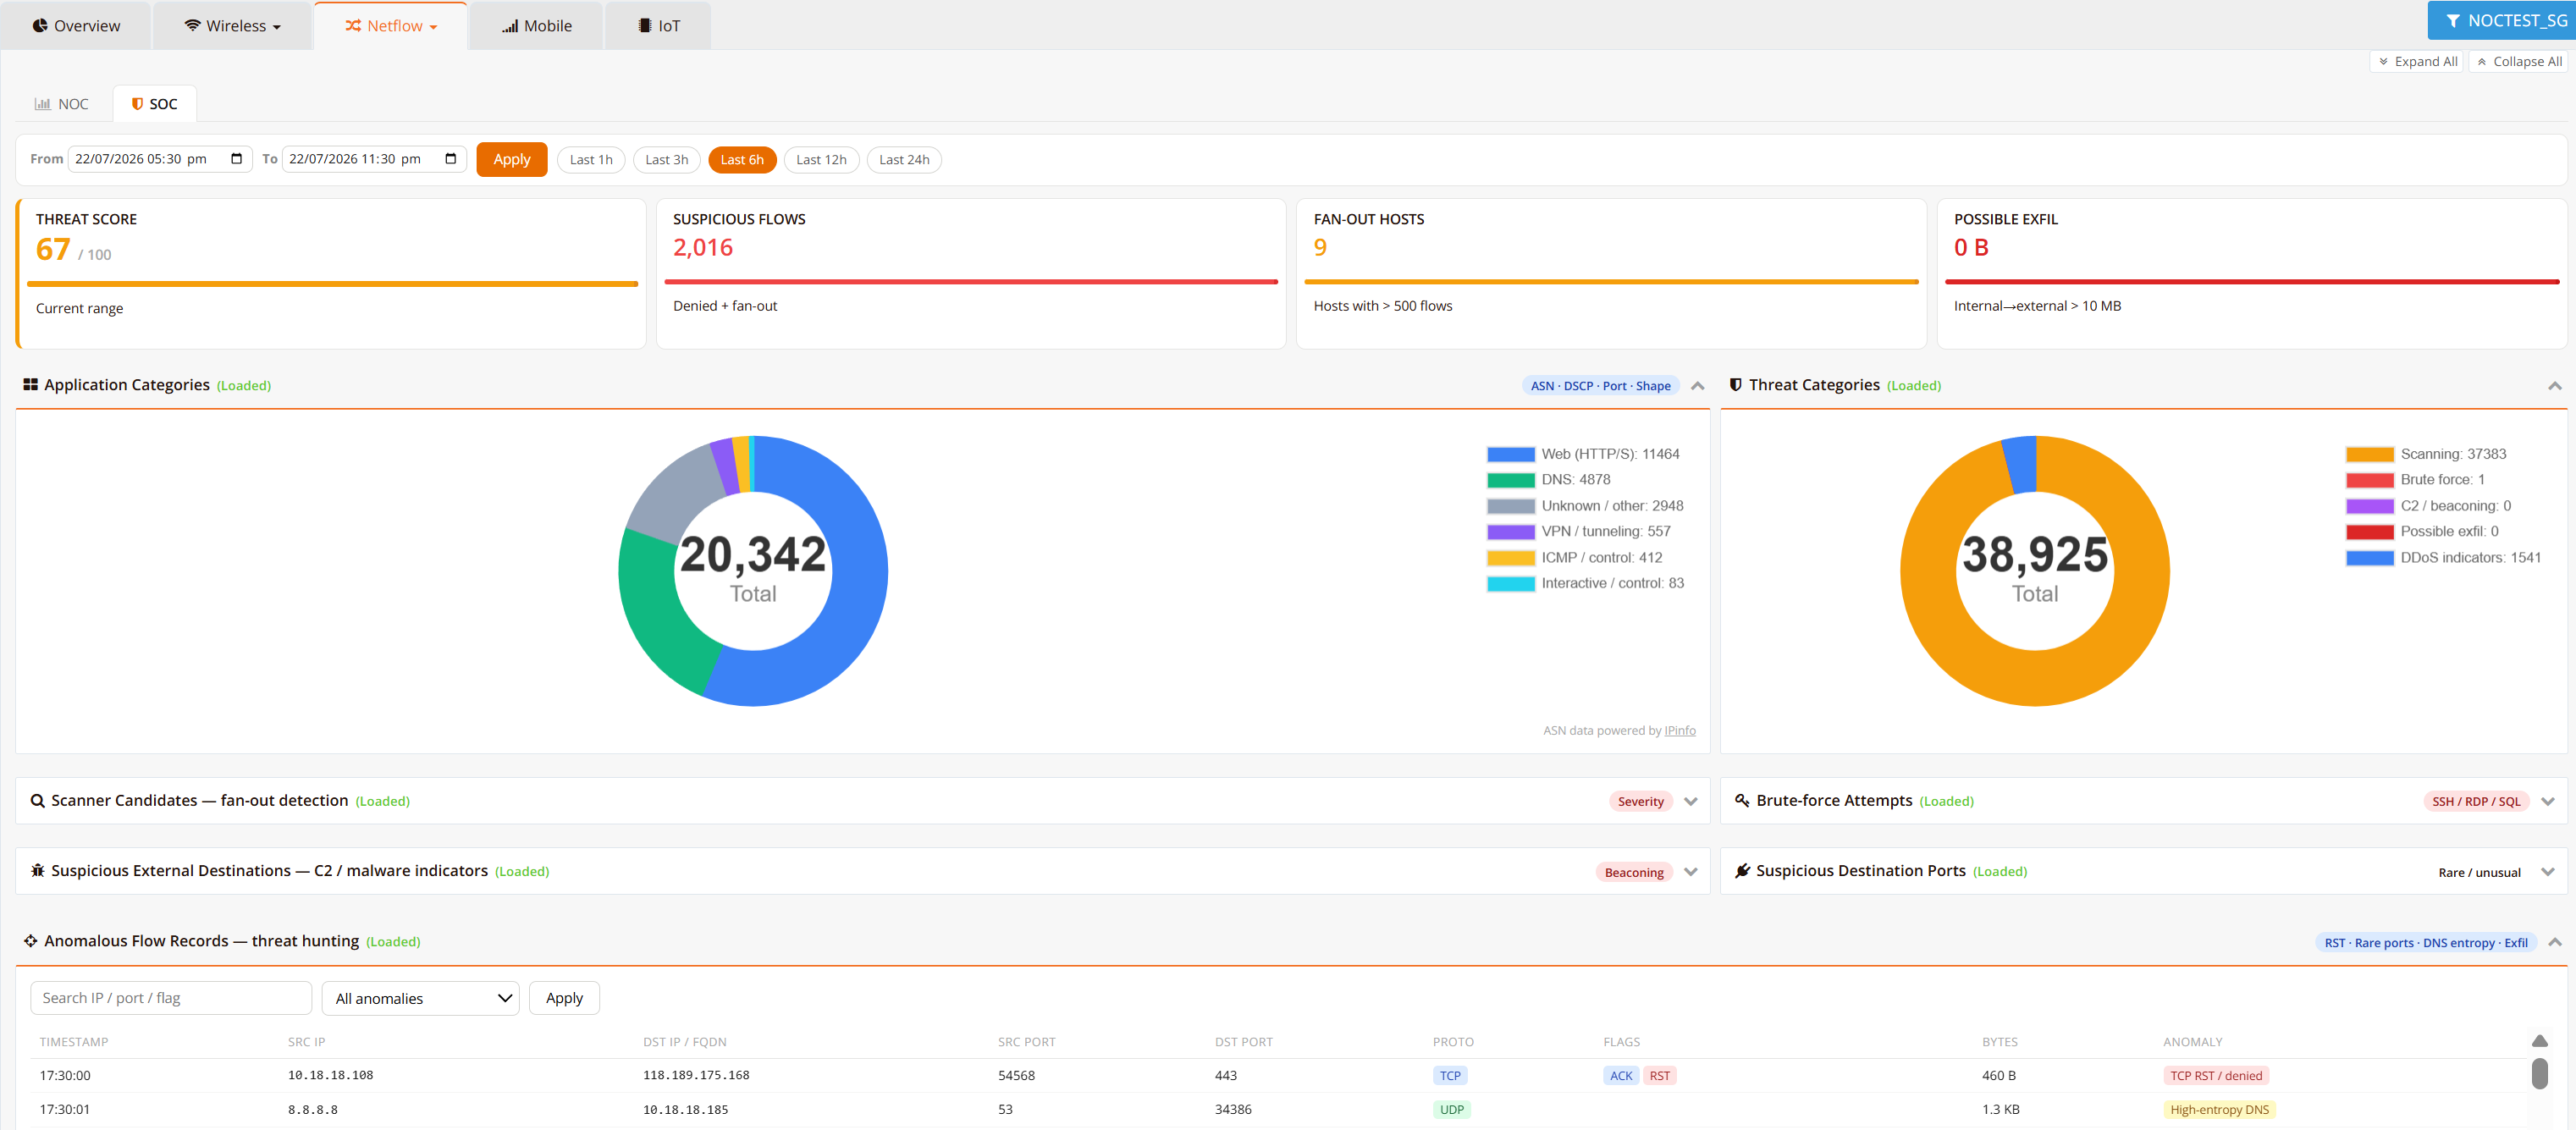
KPI tiles score the selected time range:
| Tile | Description |
|---|---|
| Threat Score | Composite 0–100 risk score for the current range |
| Suspicious Flows | Count of denied and fan-out flows |
| Fan-out Hosts | Hosts opening connections to an unusually large number of destinations (> 500 flows) — a scanning indicator |
| Possible Exfil | Internal-to-external transfer volume exceeding the exfiltration threshold (> 10 MB) |
Category charts:
| Chart | Description |
|---|---|
| Application Categories | Flow classification by application group (Web, DNS, VPN/tunneling, ICMP/control, interactive, unknown) derived from ASN, DSCP, port, and traffic shape |
| Threat Categories | Flows matching threat heuristics — Scanning, Brute force, C2/beaconing, Possible exfil, DDoS indicators |
Detection panels (expand each to inspect the matching hosts and flows):
| Panel | What it surfaces |
|---|---|
| Scanner Candidates | Fan-out detection — hosts probing many destinations or ports (reconnaissance) |
| Brute-force Attempts | Repeated connection attempts against SSH / RDP / SQL services |
| Suspicious External Destinations | C2 / malware indicators — periodic "beaconing" connections to suspicious external hosts |
| Suspicious Destination Ports | Connections to rare or unusual service ports |
Anomalous Flow Records — threat hunting lists the individual flows behind the detections, filterable by IP, port, or flag and by anomaly type (TCP RST, rare ports, high-entropy DNS, exfil). Each record shows timestamp, source/destination, ports, protocol, TCP flags, bytes, and the anomaly that flagged it.
Warning
The SOC view surfaces potential threats based on traffic patterns and heuristics. Manual review is recommended to validate findings and confirm whether flagged activity is benign (e.g., authorized scanning, legitimate bulk transfers) or a genuine security incident.
Best Practices
Monitoring and Alerting
- Set baseline thresholds — Establish normal traffic patterns by source, application, and time-of-day so anomalies stand out
- Review top talkers regularly — Check the NOC view daily or weekly to spot emerging trends before they become capacity issues
- Watch the Threat Score trend — A rising score across ranges warrants a pass through the SOC detection panels
- Investigate protocol anomalies — Rare ports, tunneling patterns, and high-entropy DNS from unexpected sources deserve follow-up
Data Retention and Compliance
- Retention policy — Configure NetFlow retention based on compliance requirements (typically 90 days to 2 years for dispute resolution and forensic investigations)
- Data privacy — NetFlow captures only headers (no packet payload), preserving user privacy while enabling investigation
- Audit trails — Export NetFlow data for archival if required by regulatory frameworks (PCI-DSS, HIPAA, SOC 2, etc.)
Investigation Workflow
- Start broad — Use the NOC view to identify suspicious sources or traffic spikes, or the SOC view's Threat Score and category charts
- Drill down — Expand the relevant detection panel or filter the Anomalous Flow Records to isolate the flows
- Resolve IPs — Map raw IP addresses to recognizable hostnames
- Document timeline — Export the filtered results as evidence for the incident record
- Correlate with other logs — Cross-reference NetFlow findings with firewall and syslog data for a complete picture
Related Features
- Monitoring Dashboard — the Overview tab and other dashboard views
- NetFlow Export — enable NetFlow export on device interfaces
- Security Logging — complementary firewall/DNS/DHCP logs for security correlation